We bottomed out at 59 degrees this morning, one degree shy of our old record of 58. The cool mornings will last for the next two days before we see an influx of moisture Sunday afternoon. The weather the next few days will be FANTASTIC! Plenty of sun, pleasant temperatures and low humidity. Does it get any better than this in the beginning of September?
Our weather pattern will start shifting Sunday night, as the upper level low spinning over the Ohio River Valley forms into a trough and ejects out of the US. When the trough does form, it will bring enough instability to create a stray shower or two further to our south, near south Georgia/north Florida, where the better moisture is situated.
The 90s will return by Tuesday and linger thru at least Thursday. In the extended period of next Friday and Saturday, it appears the GFS is bringing a front through the Deep South which would bring our highs back into the middle 80s. It would certainly be refreshing, but I want to see a little more consistency before I fully jump on.
The tropics are still active.
Tropical storm Nate is located in the Bay of Campeche with a northwesterly motion of 3 mph. The trough, mentioned above, WILL miss Nate as forecast, thus making Nate to go into Central Mexico Sunday afternoon. I'm still thinking Nate gets to a category 2 before making landfall, but it still has the CHANCE of a Cat. 3. Again, Nate will NOT effect the United States.
Maria is still hanging on to Tropical storm status as of 11AM. It is forecasted to go through the northern Lesser Antilles, as forecast a few days ago, as a tropical storm. It will then pass over Puerto Rico, where they DON'T need to the rain! In fact, they've seen almost 30 inches of rain for July and August ALONE!!! Maria will then track east of the Bahamas, as the trough mentioned a few times already in this post, will kick Maria out to sea!
Thank you,
David Reese
Friday, September 9, 2011


Thursday, September 8, 2011
Sunshine!!!
The sun is out in full force this morning! The clouds didn't clear out of here as early as I forecasted yesterday afternoon, off by 3 hours which isn't bad ;), but they cleared out just in time for sunrise. With the clouds gone, we're already warmer than we've been the past 2 days!
Here are the station plots and satellite image to illustrate what I'm talking about:


 The general idea for Nate is a drift off to the north over the next few days. The BIG question will be whether it gets picked by a trough progged to move through Monday or if it gets left behind. If it gets picked up it will head toward the northern Gulf; if it gets left behind, it will stall again and meander to the west towards Mexico.
I am sticking with my forecast from yesterday of a landfall in northern Mexico as a Cat 2 or 3 Hurricane until I see better model consistency.
Thanks for reading!
David Reese
Here are the station plots and satellite image to illustrate what I'm talking about:
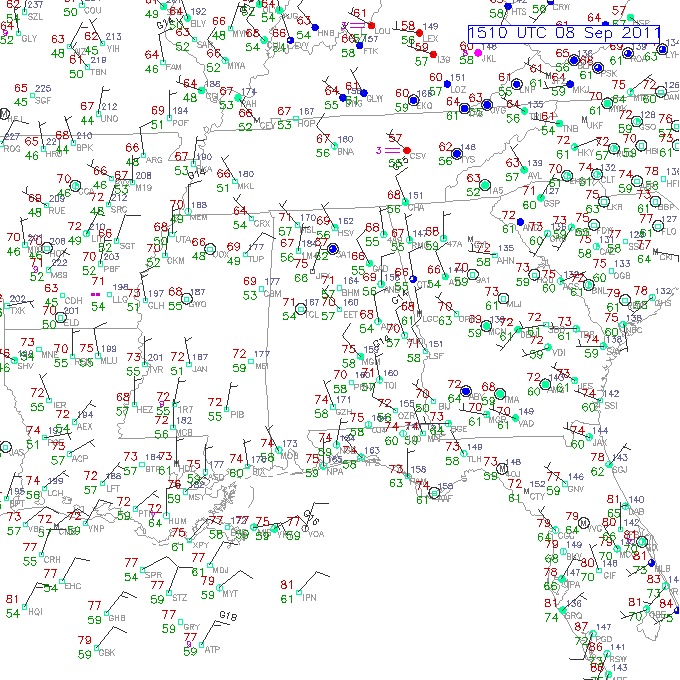

A little shortwave, providing rain across the panhandles of Texas and Oklahoma yesterday, has shunted our clouds to the east. These new clouds aren't nearly as dense as the past two days, so the sun will be able to filter through. The station plots also illustrate something else: warmer temperatures! We're already at 71 in Columbus at 11 AM. My forecast of upper 70s appears to have been too low and have adjusted upward into the lower 80s. Either way, we are still below average by a good 5 to 8 degrees; and I'm not hearing much complaining.
The forecast for the next two days are as simple as it gets: sun, sun, a cloud or two, and more sun!
Tonight: With the clear conditions, we'll be a tad cooler than last night. However, with the upper level low retrograding west, we won't get as cool as they were across West Alabama and Mississippi last night (low 50s). However, some of the traditionally cooler spots could very well be in the low 50s.
Friday: A mostly sunny afternoon, with a few clouds passing through. Highs will manage to get into the mid 80s.
Friday Night: Another night in the lower 60s with plenty of clear sky.
Football Saturday! Fantastic football weather! Mostly sunny conditions with highs in the middle 80s.
Tropics:
Maria: Continues to book it to the west at 20 to 25 mph. Right now it is forecast to be near the northern Lesser Antilles by late Friday night/Saturday morning. It is then forecast to turn north into towards Puerto Rico. This is the likely solution right now, but I will tell you; if it stays a weak tropical storm, it will make it further west across the Caribbean Sea and will need to be watched carefully! I don't think it will attain hurricane status anytime soon and a track further to the west than the NHC's forecast is likely.
Nate: Meandering around the southern Bay of Campeche. This is a TINY storm. It's forecast track by the National Hurricane Center has it essentially stalled for the next 5 day! This makes perfect sense since there isn't a strong steering current one way or the other to steer it toward Mexico or the northern Gulf of Mexico.The conditions are incredible for Nate to rapidly strengthen by Saturday and we could be talking about a Major Hurricane in the Gulf by Sunday. It appeared we were getting SOME consensus from the global models of Nate heading towards Mexico. However, the 6Z GFS and CMC threw a monkey wrench into that:

I am sticking with my forecast from yesterday of a landfall in northern Mexico as a Cat 2 or 3 Hurricane until I see better model consistency.
Thanks for reading!
David Reese
Wednesday, September 7, 2011
Clouds hung tough!
Good afternoon!
It looks like the clouds enjoyed the Deep South so much that they decided to stay for the afternoon. Here's the current satellite view:
 There has been some clearing to our west, allowing for temperatures to get into the 70s:
 Columbus has only managed a measly 68 degrees for a high! If this high holds up, it will be the record for the COLDEST High Temperature ever recorded for September 7! Crazy to think just last week we were seeing upper 90s huh.
Tonight's Forecast: You'll hear many say, "These overnight lows are all dependent on the cloud cover throughout the night." That is true! I'm forecasting the clouds to hang around another couple hours before finally dissipating some. By about 3 AM, most of our area should be seeing clearing skies meaning temperatures will easily drop into the 50s. Columbus may see the overnight low only drop into the upper 50s, while the traditionally cooler areas will see lows in the middle 50s. Keep in mind our record low temperature for tomorrow is 58 degrees, so it could be close like it was this AM.
Tomorrow: The remnants of Lee, the cause of the cloud cover the past few days, should begin its migration north. This will drag the clouds with it, but we still can't take out ALL the cloud cover. There will be enough low-level moisture to allow for a few clouds tomorrow afternoon, much like we saw this afternoon with the clouds building to the south during the afternoon. With a few peeks of sunshine, we'll manage to make it anywhere from 76 to 79 degrees tomorrow afternoon. I HAVE to say this... If we see more clouds, like today, our highs will STRUGGLE to get to the mid 70s again... Only reason I'm saying this is because I've been burned by it the past two days and my lesson is learned!
Friday: Clouds shouldn't be an issue for Friday's forecast as the upper level low continues to spin over Illinois and Indiana. That means we'll stay in a northwesterly wind flow, keeping us relatively cool compared to the average. The clouds should situate themselves across the borders of Alabama, Georgia and Tennessee, leaving us with pleasant skies and highs in the low to mid 80s (82-85).
Weekend: No major changes in store as the northwesterly flow keeps us pretty dry for the weekend. By Sunday, the ridge to our west will begin building in allowing temperatures to warm into the upper 80s by Monday. Don't be surprised to see a few low 90s in the forecast for next week as the upper air pattern flattens into a zonal flow (west to east flow aloft).
Tropics: Today saw TWO tropical storms develop in the Atlantic Basin.
Maria: Formed with the 11AM EDT advisory and is trucking it to the west at 23 mph. The center of circulation is getting a little exposed as the low level winds are much stronger than upper level winds are weaker. This will be a problem for Maria for the next 48 hours. As it gets closer to the Lesser Antilles, it will shake this shear and possibly strengthen. Until then, Maria will stay a tropical storm for the foreseeable future and impact the northern Lesser Antilles by Saturday.
Nate: JUST formed as of 5PM EDT and is moving to the ESE at 2 mph. The forecast track of Nate leave it in the Bay of Campeche for a while before it starts feeling the weakness in the ridge and migrates north. This trend won't last all that long as the trough causing the weakness lifts out, allowing a ridge to build to its north. If this occurs, we'll see Nate take a westerly track into northern Mexico. That's what I see happening as of now, but there are other scenarios: 1. Nate feels the weakness in the ridge a bit more than forecast and lifts into the northern Gulf of Mexico. 2. Nate meanders in the Gulf and gets some dry air to wrap into the core, thus weakening it (not likely to happen but still). Now, for intensity the forecast will be tricky. It has a TON of warm water to work with, low shear, weak steering currents and it being in an area where it could really go BOOM. Right now it has winds of 45 mph. The forecast intensity takes it up to a hurricane within the next 4 days. I'd have to agree with this though we could see Nate ramp up to a Cat 2 or 3 hurricane before it makes landfall... We'll keep a close on it over the next few days.
I'll leave you with a current look at Nate:
 Thanks for reading!
David Reese
It looks like the clouds enjoyed the Deep South so much that they decided to stay for the afternoon. Here's the current satellite view:


Tonight's Forecast: You'll hear many say, "These overnight lows are all dependent on the cloud cover throughout the night." That is true! I'm forecasting the clouds to hang around another couple hours before finally dissipating some. By about 3 AM, most of our area should be seeing clearing skies meaning temperatures will easily drop into the 50s. Columbus may see the overnight low only drop into the upper 50s, while the traditionally cooler areas will see lows in the middle 50s. Keep in mind our record low temperature for tomorrow is 58 degrees, so it could be close like it was this AM.
Tomorrow: The remnants of Lee, the cause of the cloud cover the past few days, should begin its migration north. This will drag the clouds with it, but we still can't take out ALL the cloud cover. There will be enough low-level moisture to allow for a few clouds tomorrow afternoon, much like we saw this afternoon with the clouds building to the south during the afternoon. With a few peeks of sunshine, we'll manage to make it anywhere from 76 to 79 degrees tomorrow afternoon. I HAVE to say this... If we see more clouds, like today, our highs will STRUGGLE to get to the mid 70s again... Only reason I'm saying this is because I've been burned by it the past two days and my lesson is learned!
Friday: Clouds shouldn't be an issue for Friday's forecast as the upper level low continues to spin over Illinois and Indiana. That means we'll stay in a northwesterly wind flow, keeping us relatively cool compared to the average. The clouds should situate themselves across the borders of Alabama, Georgia and Tennessee, leaving us with pleasant skies and highs in the low to mid 80s (82-85).
Weekend: No major changes in store as the northwesterly flow keeps us pretty dry for the weekend. By Sunday, the ridge to our west will begin building in allowing temperatures to warm into the upper 80s by Monday. Don't be surprised to see a few low 90s in the forecast for next week as the upper air pattern flattens into a zonal flow (west to east flow aloft).
Tropics: Today saw TWO tropical storms develop in the Atlantic Basin.
Maria: Formed with the 11AM EDT advisory and is trucking it to the west at 23 mph. The center of circulation is getting a little exposed as the low level winds are much stronger than upper level winds are weaker. This will be a problem for Maria for the next 48 hours. As it gets closer to the Lesser Antilles, it will shake this shear and possibly strengthen. Until then, Maria will stay a tropical storm for the foreseeable future and impact the northern Lesser Antilles by Saturday.
Nate: JUST formed as of 5PM EDT and is moving to the ESE at 2 mph. The forecast track of Nate leave it in the Bay of Campeche for a while before it starts feeling the weakness in the ridge and migrates north. This trend won't last all that long as the trough causing the weakness lifts out, allowing a ridge to build to its north. If this occurs, we'll see Nate take a westerly track into northern Mexico. That's what I see happening as of now, but there are other scenarios: 1. Nate feels the weakness in the ridge a bit more than forecast and lifts into the northern Gulf of Mexico. 2. Nate meanders in the Gulf and gets some dry air to wrap into the core, thus weakening it (not likely to happen but still). Now, for intensity the forecast will be tricky. It has a TON of warm water to work with, low shear, weak steering currents and it being in an area where it could really go BOOM. Right now it has winds of 45 mph. The forecast intensity takes it up to a hurricane within the next 4 days. I'd have to agree with this though we could see Nate ramp up to a Cat 2 or 3 hurricane before it makes landfall... We'll keep a close on it over the next few days.
I'll leave you with a current look at Nate:

David Reese
Cooler weather and clouds hang around
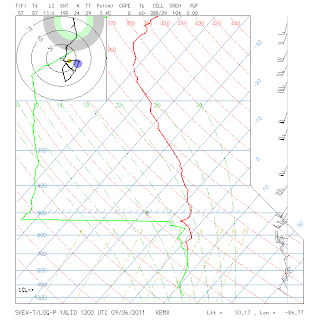
Good Wednesday morning everyone! We saw temperatures dip into the upper 50s in some spots. Columbus dipped down to 59, one degree shy of tying our old record low of 58! Things should warm up a tad more than yesterday as the cloud deck isn't as thick. You may be asking how I know the clouds aren't as dense... Well, let me show you! Here's a sounding from Peachtree City, GA from 8 AM this morning:
 Notice the red line, temperature profile, and the green line, dew point profile, are very close together near the surface. When these two lines are close together, there are likely clouds throughout that layer. To show you proof of the clouds I'm talking about; here's the visible satellite image from this morning:
 The clouds are starting to dissipate just a bit and with the heating of the day we'll see them clear out of the sky! This will allow temperatures to creep into the mid 70s rather than the mid 60s we saw yesterday afternoon.
Tropics:
We have a few tropical disturbances we're keeping an eye on. The first is Hurricane Katia which is forecast to pass between Bermuda and the United States. The affects Katia will have for the US are strong rip current, high surf (surf's up dude!) and minor coastal flooding.
The second tropical entity we are keeping an eye on is Tropical Depression #14.


Tropics:
We have a few tropical disturbances we're keeping an eye on. The first is Hurricane Katia which is forecast to pass between Bermuda and the United States. The affects Katia will have for the US are strong rip current, high surf (surf's up dude!) and minor coastal flooding.
The second tropical entity we are keeping an eye on is Tropical Depression #14.
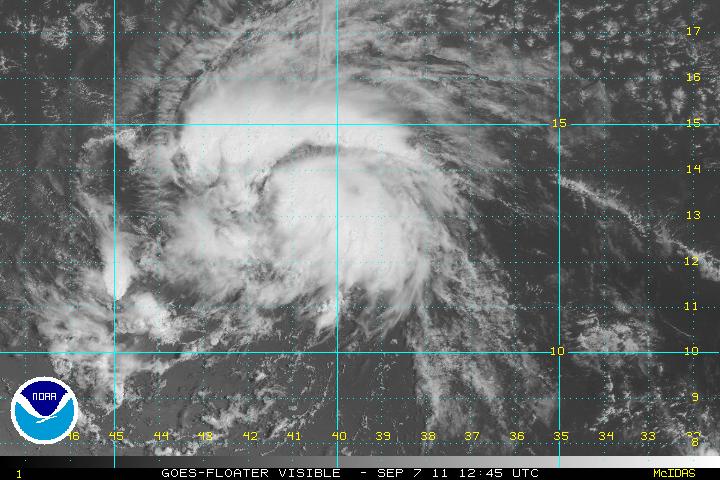
It's looking pretty decent on satellite this morning and I anticipate it to become our next tropical storm of the season, Tropical Storm Maria. The upper atmosphere is conducive for development over the next 24 to 48 hours, but beyond that it will have to deal with some wind shear. We'll have to watch out for Maria and its potential impacts for the Leeward Islands and Puerto Rico.
Another area of convection is firing up in the Bay of Campeche. It has been designated Invest 96L:

It's firing up along an old frontal boundary; in fact, this is part of the energy left behind by Lee earlier this week! We'll have to watch this one closely as the Euro and CMC bring this towards the Louisiana coastline, while the GFS takes it into Mexico. Here's the "spaghetti" plots of the models:

Here's my thinking on Invest 96L: As long as the dry air to the north of Invest 96L, dry air from the Texas drought, manages to stay to the north and doesn't get mixed into 96L then we'll see our next depression of the season later tonight or tomorrow morning. The ultimate location of the low level center(LLC) WILL BE IMPERATIVE! If it develops a little further to the north, more in the southern Gulf than the Bay of Campeche, it will track to the north and influence the northern Gulf Coast. If it develops in the heart of the Bay of Campeche, it will not get picked up by the trough progged to move through later this week. Right now, I'm thinking it will drift north initially and get left behind by the incoming trough and meander west into northern Mexico. This forecast is fairly low confidence as we don't have a LLC yet, just putting different scenarios out there!
Thanks!
David Reese
Tuesday, September 6, 2011
How I forecast every morning
I was posed the question: Do broadcast meteorologists do any calculations? The answer to this particular question 98% of the time, for me, is: No, I do not do any calculations. Most of the calculations I would potentially do are already done for me by computer programs so I take advantage of that. Yes, I will admit, if I want it 100% accurate and done correctly, I should do them every morning. I just don't have time in my everyday activities to sit there and do them.
The next question, "What exactly do you do to forecast?" That my friend, is a little more involved.
Before the advent of computers, meteorologists, on-air or off-air, got data streamed into them, over phone lines if I'm not mistaken, from the National Weather Service. They printed this data off on LONG sheets of paper, you know the good ole printer paper with the perforated edges. They then PLOTTED all of the points by hand like so:

The meteorologists analyzed the data (maybe not as nice or as colorful but you get the idea):

and put together their forecast. It was immensely time consuming and took about 4 hours to complete every day.
That was the old days. Fast-forward 40 years and you have a brand new world of forecasting. No longer do many meteorologists print out data sheets and plot them individually. No longer do we have to wait for data to become available to us. The advent of the internet cured this. Granted, I should note that there ARE some meteorologists who still do plot weather maps by hand from radiosonde data.
Now that we got some of the background of old-school meteorologists, let's get back to the original topic: What I do every morning.
I walk into the station at around 3 AM and log into my computer. I then go over to our weather computers and bring up this map:
 This is a water vapor map, I usually view it in motion, showing where the dry/moist air is in the mid to upper levels of the atmosphere. The reds indicate dry air and the whites, purples, blues and greens indicated more moisture, in that order. It tell me if there is a chance for mid-upper level clouds, frontal systems, areas of high pressure, shortwaves embedded within a long-wave trough which could lead to rain (or drier air) for particular areas downstream among other things. Water Vapor Imagery is a great tool to have that is garnered by geostationary satellites high above the earth.
The next piece of data I look at:
 The visible satellite! This was taken over the Deep South on September 6, 2011 at 1806Z (or 2:06 PM EDT). Visible satellites, also in space ;), capture the light being reflected off cloud tops. Clouds can wreck HAVOC on a meteorologist's forecast if he doesn't predict their motion or rate of dissipation correctly. For instance, this morning when I forecasted, I didn't properly forecast the cloud cover. As a result, my forecast high temperature busted by about 8/9 degrees. Not the greatest forecast, I know, but you learn from it and move on.
The next few pieces of data I look at are the latest soundings, or temperature and dew point profiles (vertically from one point) of the atmosphere at certain locations around the US:

 The first sounding is from Peachtree City, GA and the second is from Birmingham, AL. The red line is the temperature and the green line is dew point. A LOT of calculations can be done from just one of these soundings; e.g. CAPE, Lifted Index (LI), Convective Temperature, CIN, Level of Free Convection (LFC), Lifted Condensation Level (LCL), Precipitable Water (PW), Equilibrium Level (EL), etc...We don't have to calculate these every day because we have computers and programs to speed the process along. I did a TON of these calculations, by hand, in school. All those computations are important for severe weather days (CAPE, CIN, LFC, EL, LI, PW) , forecasting clouds (LCL), forecasting rain (PW), chance of thunderstorms... That's all calculated from just the temperature and dew point lines! Look on the right hand side of the diagrams, the official name is Skew-T diagrams), Notice the wind bards changing direction as you get higher in the sky and different notches or flags. This is important in telling if cold or warm air is moving in.
Now look at these next plots:

 These are station plots from around the Deep South. Notice the same wind barbs found on the Skew-T diagrams are also found here. The wind barbs depicted here are surface winds and can also tell me if colder or warmer air is on its way. The first one is from September 5, 2011 at 2PM, while the second is from September 6, 2011. Notice how the top one shows temperatures in the 60s in northern MS and AL and the winds blowing from the north to northwest. Now, look at the second image. The colder temperatures have shifted to the east with the area of low pressure. Upper-level winds, about 30,000+ feet in the air, blow from west to east across the US, meaning most weather systems will track from California to New York. It should be noted that this is HARDLY ever the case, but I can explain that later if you ask me.
All I have done is figure out what has ALREADY happened! In order to FORECAST the weather, I need to look at sophisticated computer models. Here are a links to a fraction of the models I use: OSU MOS and Mean Sea Level Pressure GFS (there are MANY other maps to look at on this site, but just wanted to give you a feel for what I look at on the surface). These are tools for me to be able to forecast 2+ days out! I can do alright within 24 hours with the stuff mentioned above, but I need these guidance models to help me get a sense of what's going to happen the next seven days. Each model has its own biases and has to be taken into account. I also have to sit there and tell myself, "Does this make sense!?" I ask that question a lot each morning and is what makes my job fun! And no, in case you were wondering, it doesn't always make sense. Hence the fun part ;)
This should give you a general sense of what I do every morning when I step into the station. I hope you enjoyed reading through it all and if you have any questions, don't hesitate to ask!
David Reese
Morning Meteorologist
WRBL TV-3
The next question, "What exactly do you do to forecast?" That my friend, is a little more involved.
Before the advent of computers, meteorologists, on-air or off-air, got data streamed into them, over phone lines if I'm not mistaken, from the National Weather Service. They printed this data off on LONG sheets of paper, you know the good ole printer paper with the perforated edges. They then PLOTTED all of the points by hand like so:

The meteorologists analyzed the data (maybe not as nice or as colorful but you get the idea):

and put together their forecast. It was immensely time consuming and took about 4 hours to complete every day.
That was the old days. Fast-forward 40 years and you have a brand new world of forecasting. No longer do many meteorologists print out data sheets and plot them individually. No longer do we have to wait for data to become available to us. The advent of the internet cured this. Granted, I should note that there ARE some meteorologists who still do plot weather maps by hand from radiosonde data.
Now that we got some of the background of old-school meteorologists, let's get back to the original topic: What I do every morning.
I walk into the station at around 3 AM and log into my computer. I then go over to our weather computers and bring up this map:

The next piece of data I look at:

The next few pieces of data I look at are the latest soundings, or temperature and dew point profiles (vertically from one point) of the atmosphere at certain locations around the US:


Now look at these next plots:


All I have done is figure out what has ALREADY happened! In order to FORECAST the weather, I need to look at sophisticated computer models. Here are a links to a fraction of the models I use: OSU MOS and Mean Sea Level Pressure GFS (there are MANY other maps to look at on this site, but just wanted to give you a feel for what I look at on the surface). These are tools for me to be able to forecast 2+ days out! I can do alright within 24 hours with the stuff mentioned above, but I need these guidance models to help me get a sense of what's going to happen the next seven days. Each model has its own biases and has to be taken into account. I also have to sit there and tell myself, "Does this make sense!?" I ask that question a lot each morning and is what makes my job fun! And no, in case you were wondering, it doesn't always make sense. Hence the fun part ;)
This should give you a general sense of what I do every morning when I step into the station. I hope you enjoyed reading through it all and if you have any questions, don't hesitate to ask!
David Reese
Morning Meteorologist
WRBL TV-3
Thursday, July 14, 2011

Current analysis shows a stalled frontal boundary right over the top of us. This will provide us with better coverage for showers and thunderstorms later this afternoon. A few of the storms could produce locally heavy rainfall and the threat for some microbursts, areas of gusty winds. Other than that, temperatures will manage to get into the mid 90s before the rain moves in, with slightly lower heat indices because of the cooler temperatures.
As we go into Friday, a backdoor cool front will work its way down the Appalachians. Combine this with a high pressure over the Northeast setting up a Cold Air Damming (CAD) situation for east Georgia. We could feel the effects locally in the form of rain and temperatures in the upper 80s to near 90. The front will slowly move south on Saturday, before clearing out Sunday.
Sunday and Monday will see highs near normal, with afternoon showers and storms possible in the afternoon. Tuesday will begin the warming trend with a STRONG high pressure building into the southeast. This will bring back the upper 90s by Wednesday.
Wednesday, July 13, 2011
Warmest Ever Overnight Temp for July 13th
We tied a record high MINIMUM temperature this morning in Columbus. The thermometer never dipped below 78 degrees, tying the old record set in 1991.
The warmth will continue at least the next 24 hours, before we begin to see a few changes. The change will come in the form of "cooler" temperatures and better rain chances. A trough of low pressure situated along the Gulf Coast will advance north, along a backdoor frontal system will sag south; the combination of the two will allow me to increase rain chances across West Central Georgia and East Central Alabama the next few days. The weekend will see a smattering of storms in the afternoon, but the temperatures will still be in the low to mid 90s for daytime highs.
As we advance into next week, we'll see another ridge of high pressure build over the Ohio River Valley. The axis of the ridge will keep the hottest temperatures to our north, but I am forecasting highs to rebound into the middle 90s. Also, since we will be on the periphery of this high, we'll have to watch for a few dying Mesoscale Convective Systems approach us from the north. These could pack quite a punch if they are able to hold together through Alabama and Georgia.
The National Hurricane Center has given a disturbance in the Bay of Campeche a 50% chance of developing within the next 48 hours. Taking a look at the loop below shows there is SOME rotation with it and its proximity to the coastline equals not a great chance of it developing, but there is still that chance.
Bay of Campeche
The warmth will continue at least the next 24 hours, before we begin to see a few changes. The change will come in the form of "cooler" temperatures and better rain chances. A trough of low pressure situated along the Gulf Coast will advance north, along a backdoor frontal system will sag south; the combination of the two will allow me to increase rain chances across West Central Georgia and East Central Alabama the next few days. The weekend will see a smattering of storms in the afternoon, but the temperatures will still be in the low to mid 90s for daytime highs.
As we advance into next week, we'll see another ridge of high pressure build over the Ohio River Valley. The axis of the ridge will keep the hottest temperatures to our north, but I am forecasting highs to rebound into the middle 90s. Also, since we will be on the periphery of this high, we'll have to watch for a few dying Mesoscale Convective Systems approach us from the north. These could pack quite a punch if they are able to hold together through Alabama and Georgia.
The National Hurricane Center has given a disturbance in the Bay of Campeche a 50% chance of developing within the next 48 hours. Taking a look at the loop below shows there is SOME rotation with it and its proximity to the coastline equals not a great chance of it developing, but there is still that chance.
Bay of Campeche
Subscribe to:
Posts (Atom)